 BTR Enerji
How accurate is the solar tracker simulator? A PVGIS comparison at 12 sites
If you are making an investment decision, you need to know how far to trust the result. We compared our simulator with the European Commission's PVGIS calculation using the same inputs, and we report both where it agrees and where it does not.
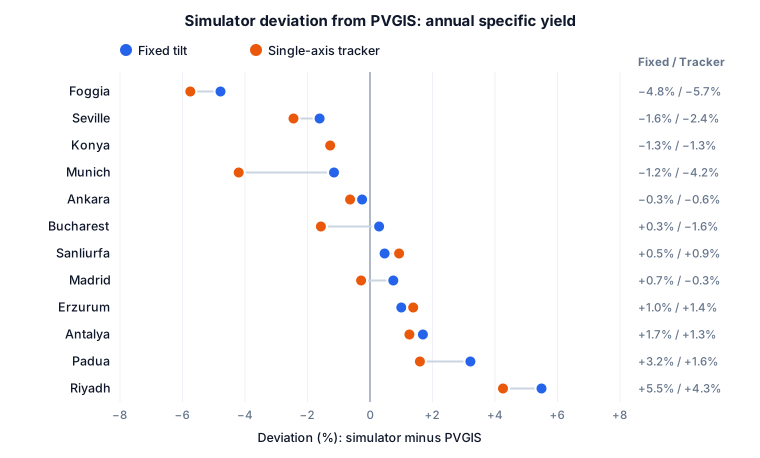
Short answer: at 12 sites with the same losses entered, the simulator differs from PVGIS by +0.3% on average for fixed tilt and −0.6% for trackers. Regardless of direction, the average deviation is 1.8% for fixed tilt and 2.1% for trackers. The largest differences are in Riyadh and Foggia.
How we compared them
- Reference: the free PVGIS PVcalc service from the European Commission's Joint Research Centre (version 5.3, PVGIS-SARAH3 irradiance).
- Same inputs: monofacial modules. The system loss and inverter efficiency the simulator calculated for each site were entered as the PVGIS loss (7.5% to 11.0% depending on the site). Clipping and transformer loss were left out of the comparison.
- Same angle: the simulator's chosen tilt for fixed systems, a horizontal north-south axis for trackers.
- Date: the simulator version of 1 November 2026.
The full table at the end of this page is available as CSV.
Where do the differences come from?
Weather data. The simulator uses the PVGIS typical year, while PVcalc uses a multi-year average. The typical-year horizontal irradiation differs from PVcalc by −3.4% in Foggia and +2.5% in Padua. That explains most of the deviation at these two sites: it is the choice of year more than the model.
Riyadh is unexplained. The irradiation difference there is only +0.6%, yet the simulator is +5.5% higher for fixed tilt. We have not yet isolated the cause. Read results for hot, arid sites with that margin in mind.
Tracker geometry. The PVGIS single-axis calculation does not model row-to-row shading or backtracking; the simulator models both. So the simulator gives a lower gain as the sun gets lower: 12.0% against 15.5% in Munich. Since rows do shade each other on real plants, this difference is expected.
What this page does not prove
- PVGIS is also a model, not a measurement. What is shown here is consistency with an independent model.
- There is no comparison with measured plant data yet. We will add it when publishable measurements are available.
- Bifacial gain is outside this comparison because PVGIS has no equivalent.
- Outside Europe, Türkiye and the Middle East: in the Americas PVGIS may offer only reanalysis data, which can deviate. Our Latin America articles use NASA POWER for that reason, and the app shows a warning when it falls back to a secondary weather source.
What does the simulator calculate?
Hourly weather, single-axis tracking and backtracking, terrain slope, bifacial irradiance (pvlib infinite sheds), incidence-angle loss, cell temperature, soiling, snow, cabling, mismatch, inverter efficiency and clipping, transformer loss. Full feature list: solar tracker design software. On uncertainty: P50 and P90.
All results (kWh/kWp · year)
| Site | Fixed: simulator | Fixed: PVGIS | Diff. | Tracker: simulator | Tracker: PVGIS | Diff. | Gain: simulator | Gain: PVGIS |
|---|---|---|---|---|---|---|---|---|
| Foggia | 1,513 | 1,589 | −4.8% | 1,787 | 1,896 | −5.7% | 18.1% | 19.4% |
| Seville | 1,768 | 1,797 | −1.6% | 2,152 | 2,206 | −2.4% | 21.7% | 22.7% |
| Konya | 1,669 | 1,691 | −1.3% | 2,013 | 2,039 | −1.3% | 20.6% | 20.5% |
| Munich | 1,202 | 1,216 | −1.2% | 1,345 | 1,404 | −4.2% | 12.0% | 15.5% |
| Ankara | 1,577 | 1,581 | −0.3% | 1,876 | 1,888 | −0.6% | 19.0% | 19.4% |
| Bucharest | 1,375 | 1,371 | +0.3% | 1,567 | 1,592 | −1.6% | 14.0% | 16.1% |
| Sanliurfa | 1,719 | 1,711 | +0.5% | 2,062 | 2,043 | +0.9% | 19.9% | 19.4% |
| Madrid | 1,753 | 1,740 | +0.7% | 2,103 | 2,109 | −0.3% | 20.0% | 21.2% |
| Erzurum | 1,513 | 1,498 | +1.0% | 1,760 | 1,736 | +1.4% | 16.3% | 15.9% |
| Antalya | 1,802 | 1,772 | +1.7% | 2,169 | 2,142 | +1.3% | 20.3% | 20.9% |
| Padua | 1,510 | 1,463 | +3.2% | 1,718 | 1,691 | +1.6% | 13.7% | 15.6% |
| Riyadh | 1,961 | 1,859 | +5.5% | 2,303 | 2,209 | +4.3% | 17.4% | 18.9% |
Pick your location and draw your land on the map. Get hourly-weather-based yield, a tracker vs fixed-tilt comparison, a bill of materials and the payback period, free of charge.
Free Solar Tracker Simulation
Frequently asked questions
Has the simulator been validated against measured plant data?
There is no published comparison with measurements yet. This page shows consistency with an independent model (PVGIS); measured data will be added when it is publishable.
Why can results differ from PVGIS?
The simulator uses a typical year while PVcalc uses a multi-year average. The simulator also models row shading and backtracking, which the PVGIS single-axis calculation does not.
What margin should I apply to the results?
At these 12 sites the difference is mostly within ±2%, with a largest difference of about 6%. A financing decision needs site measurements, P50/P90 analysis and an independent energy report.
We deliver the whole project: feasibility, engineering, procurement, installation and grid connection, in Türkiye and abroad. Simulate your site for free first, then let our team prepare a tailored quote. Get a quote in 48 hours →
Start the Simulation and Get a Quote
The results on this page come from simulation and are not binding; exact values are determined by a site-specific analysis.