 BTR Enerji · Solar Tracker
P50 and P90 Explained: Uncertainty in Solar Plant Energy Yield Forecasts
A solar plant's annual energy output is not a single number: weather differs every year and the model carries its own share of uncertainty. Investors and banks therefore speak in probabilities such as P50, P75 and P90. This article explains what they mean, how they are calculated and how they look for a 10 MWp example plant: P90 yield is about 93% of P50.
The short answer
P50 is the annual yield exceeded with 50% probability, the central estimate. P90 is the more conservative value exceeded with 90% probability. P90 is always lower than P50, and the gap shows how uncertain the forecast is. Banks often size debt not on P50 but on a more conservative value, typically P90.
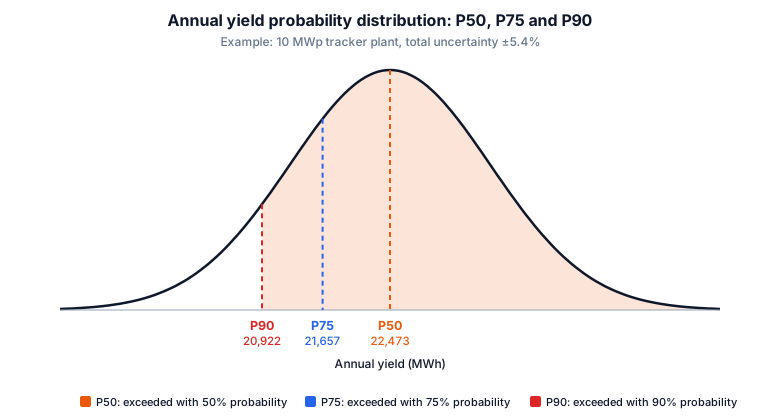
What the values mean
- P50: exceeded with 50% probability; a coin toss. The central (most likely) estimate.
- P75: exceeded with 75% probability; in three years out of four this value is reached or beaten.
- P90: exceeded with 90% probability; in nine years out of ten yield should be above this value.
P90 being below P50 is not a "bad scenario" forecast but an expression of the uncertainty margin. The larger the uncertainty, the lower P90 sits.
How it is calculated
There are two main sources of uncertainty and, being independent, they are combined by the root of the sum of squares (RSS):
- Year-to-year weather variability. With hourly real weather data for the last 10 years (Open-Meteo ERA5) we compute the yield of each year; the standard deviation between years gives this term.
- Model and measurement uncertainty. The combined share of irradiance data accuracy, module and inverter parameters and loss assumptions; our simulator uses a fixed 5%.
If the total uncertainty is σ, then under a normal distribution P90 = P50 × (1 − 1.282σ) and P75 = P50 × (1 − 0.674σ).
Example: a 10 MWp tracker plant
Values from our simulator for a 10 MWp tracker plant on the Karapınar plain in Konya:
| Value | Annual yield | Share of P50 |
|---|---|---|
| P50 | 22,473 MWh | 100% |
| P75 | 21,657 MWh | 96.4% |
| P90 | 20,922 MWh | 93.1% |
Year-to-year weather variability is 2.0% and model uncertainty 5.0%; combined they give a total uncertainty of ±5.4%. Note that the main source of total uncertainty is not the weather but the model's own share.
Pick your location and draw your land on the map. Get hourly-weather-based yield, a tracker vs fixed-tilt comparison, a bill of materials and the payback period, free of charge.
Free Solar Tracker Simulation
How much does yield move between years?
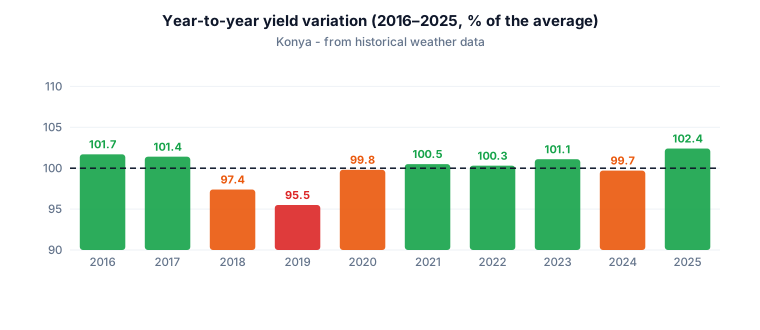
For Konya we calculated the plant's yield in each year from 2016 to 2025 as a percentage of the ten-year average:
Does the P90 / P50 ratio change by location?
We ran the same calculation for each of 9 locations with 10 years of ERA5 data. Counter-intuitively, the result is quite narrow:
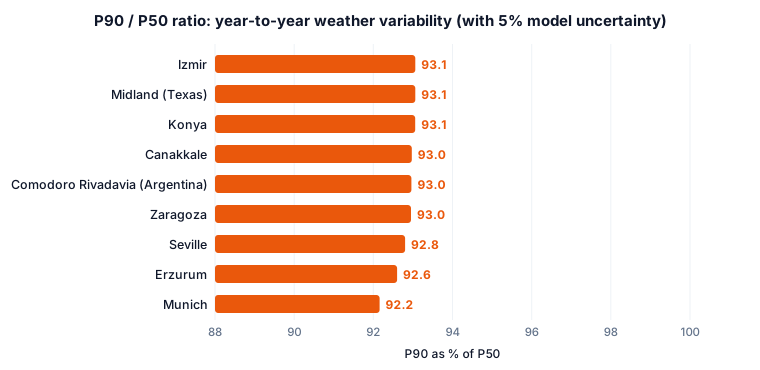
Weather variability ranges from 2.1% to 3.5% across climates; because the fixed 5% model uncertainty dominates the total, the P90/P50 ratio stays within about one percentage point. So the way to reduce uncertainty is not to change the climate but to improve the inputs: on-site measured irradiance, real module and inverter parameters, measured loss data.
Limits and proper use
- This calculation is indicative; a formal Energy Yield Assessment for a bank is prepared by an independent engineering firm with on-site measurements.
- A normal-distribution assumption can make rare extreme years look more benign than they are.
- P50 is not a guarantee: in five years out of ten yield falls below P50. That is expected and normal.
- Long-term climate change and module degradation are treated separately in the financial model.

Checklist
- Ask for P90 (and, if needed, P99) alongside P50 for the plant.
- Ask what the uncertainty is made of: weather, model, measurement, losses.
- Find out the source and year of the input data (TMY or multi-year measurement?).
- For the bank, do the maths with the probability value the lender requires, not P50.
Related: Solar tracker design software · Solar tracker vs fixed-tilt.
Frequently asked questions
What does P50 mean?
The annual yield of a solar plant that is exceeded with 50% probability, the central yield forecast. There is an even chance of yield above or below this value.
Why is P90 lower than P50?
P90 is the more conservative value exceeded with 90% probability. It sits below P50 by the uncertainty margin (weather variability and model uncertainty). In the 10 MWp example P90 is 93.1% of P50.
Why do banks ask for P90?
Debt service is sized on a more conservative value so it can be met even in poor years. Most lenders use P90, sometimes P99.
How can I improve a P50/P90 estimate?
Most uncertainty comes from the model and measurements; on-site measured irradiance, real module and inverter parameters and measured loss data reduce it.
We deliver the whole project: feasibility, engineering, procurement, installation and grid connection, in Türkiye and abroad. Simulate your site for free first, then let our team prepare a tailored quote.
Start the Simulation and Get a Quote
The ratios on this page are typical industry ranges and are not binding; exact values are determined by a site-specific analysis.