 BTR Enerji · Solar Tracker
How Much Earthwork Does a Solar Tracker Site Need? Cut and Fill by Slope, Undulation and Table Length
What drives site-preparation cost on a tracker project is less the slope itself than how the slope changes along the table axis. We ran our simulator's cut-and-fill model on 10-hectare synthetic sites: on a uniform slope earthworks are zero up to 15% and reach 7,021 m³/ha at 20%. On rolling terrain the decisive factor is wavelength versus table length: with ±1 m amplitude and a 100 m wavelength a 74 m table needs 537 m³/ha, a 37 m table only 4 m³/ha.
Short answer
A single-axis tracker table is a straight beam running north-south. If the ground falls at a uniform slope, the table simply follows it; as long as the axis slope stays below the tolerance (15% in our model) no grading is needed. Earthworks come from two situations: the slope exceeding the tolerance, and the ground undulating along the table. In the second case shorter tables reduce earthworks dramatically, but they increase the number of tables and drives. Final quantities come from a topographic survey.
How did we calculate the earthworks?
Our simulator's terrain module fits every tracker table to the ground profile at 5 m steps along its axis:
- The table axis is placed as the best-fit straight line through the profile, with its slope clamped to the 15% axis tolerance.
- Piles absorb the gap between ground and beam by adjusting their reveal up to ±0.30 m.
- Any gap beyond that allowance becomes cut or fill in m³, summed over the row-pitch width (cut ≈ fill, balanced on site).
Because no real site can be described by a single parameter, we used synthetic terrain to isolate each effect: a 320 × 320 m (10.24 ha) area on a 5 m elevation grid, with (a) uniformly sloped planes and (b) rolling surfaces of different amplitude and wavelength. Layout: 6.04 MWp on 10 ha, row pitch 7.45 m; long table 1P56 (74 m), short table 1P28 (37 m).
When do earthworks start on a uniform slope?
| Slope along the axis | 1P56 (74 m) m³/ha | 1P56 m³/MWp | 1P28 (37 m) m³/ha | 1P28 m³/MWp |
|---|---|---|---|---|
| 10% | 0 | 0 | 0 | 0 |
| 15% | 0 | 0 | 0 | 0 |
| 18% | 3,270 | 5,411 | 934 | 1,545 |
| 20% | 7,021 | 11,617 | 2,872 | 4,752 |
| 25% | 16,638 | 27,530 | 8,128 | 13,449 |
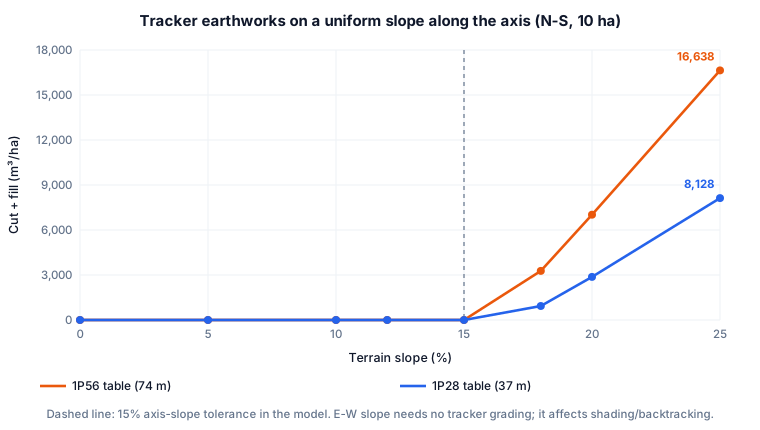
Up to a 15% axis slope every table follows the ground and earthworks are zero. Beyond the threshold the volume grows quickly: 3,270 m³/ha at 18% (≈ 5,411 m³/MWp) and 16,638 m³/ha at 25%. Shorter tables help here too (2,872 instead of 7,021 m³/ha at 20%), because the gap between beam and ground grows towards the table ends in proportion to table length. An east-west slope needs no tracker grading at all, since rows are independent; it only affects row-to-row shading and backtracking (see terrain-aware backtracking).
What really matters on rolling terrain?
Many sites that look like plains are in fact gently rolling: humps and hollows of ±0.5–2 m every few tens of metres. With an average slope of 2–3% such land looks "flat", yet it gets caught between the straight beam and the pile allowance.
| Undulation (amplitude / wavelength) | 1P56 m³/ha | 1P56 tables needing grading | 1P28 m³/ha | 1P28 tables needing grading |
|---|---|---|---|---|
| ±0.5 m / 60 m | 219 | 54% | 8 | 22% |
| ±0.5 m / 100 m | 40 | 55% | 0 | 0% |
| ±1.0 m / 60 m | 1,492 | 86% | 353 | 56% |
| ±1.0 m / 100 m | 537 | 80% | 4 | 13% |
| ±1.0 m / 160 m | 84 | 60% | 0 | 0% |
| ±2.0 m / 100 m | 2,387 | 90% | 278 | 50% |
| ±2.0 m / 160 m | 885 | 82% | 0 | 0% |
| ±2.0 m / 250 m | 34 | 29% | 0 | 0% |
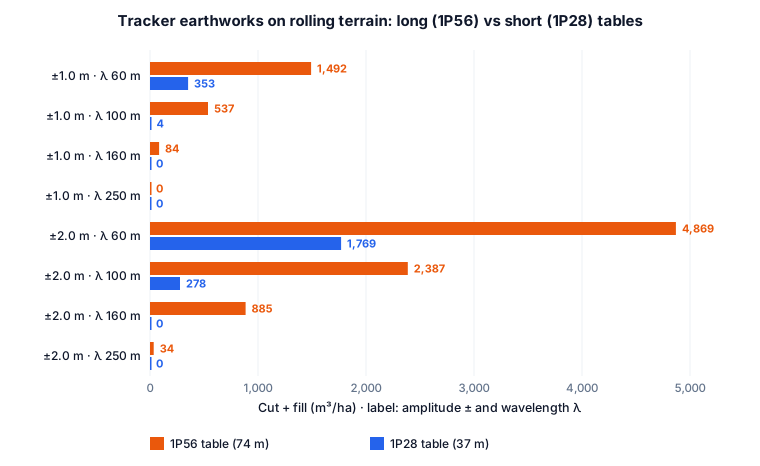
The practical rule that emerges: once the wavelength exceeds roughly three times the table length, earthworks almost disappear. For a 74 m table a 250 m wavelength is above that limit and 160 m is below it; for a 37 m table even 160 m is enough. With ±1 m amplitude and a 100 m wavelength, 80% of 1P56 tables need grading versus 13% of 1P28 tables. At ±2 m amplitude short tables are no longer enough: at a 60 m wavelength even 1P28 leaves 1,769 m³/ha.
Pick your location and draw your land on the map. Get hourly-weather-based yield, a tracker vs fixed-tilt comparison, a bill of materials and the payback period, free of charge.
Free Solar Tracker Simulation
Are shorter tables always better?
No. On the same 10 ha, 152 tables fit with 1P56 and 303 with 1P28; the table count nearly doubles. Since each table has its own drive and control unit, the number of drives, cables and piles rises, while installed capacity stays almost the same (6.04 vs 6.02 MWp). The right approach is to keep the long table as the default and use short tables only where earthworks concentrate. The decision weighs the extra equipment of short tables against the avoided earthworks (excavation, haulage, compaction, erosion control); unit prices vary widely by region, so this comparison has to be made project by project.
Why can elevation data underestimate earthworks?
The digital elevation models used in pre-feasibility (EU-DEM 25 m, SRTM 30 m) give one point every 25–30 m. At that resolution humps and hollows with a wavelength below roughly 50–60 m are invisible, yet the largest volumes in our tables occur precisely at those short wavelengths. Earthworks computed from satellite data should therefore be read as a lower bound; final quantities require a drone photogrammetry or GNSS topographic survey. Our simulator accepts survey files (GeoTIFF, DXF, CSV) directly and recalculates table by table.
Site-preparation checklist
- Topographic survey: point spacing of 5 m or less, with streams and drainage lines marked.
- Axis-slope map: zones above 15% highlighted and assessed for short tables, stepped grading or exclusion from the layout.
- Pile allowance: a tolerance such as ±0.30 m depends on the manufacturer's pile lengths and beam connection details; confirm it with the product actually used.
- Cut-fill balance: importing or exporting soil adds haulage cost; aim for balanced grading.
- Soil and erosion: plan compaction, revegetation and storm-water management on graded surfaces (general guide: solar tracker slope tolerance and earthworks).
Method and limitations
- Model: our simulator's cut-and-fill module (best-fit line per table, 15% axis tolerance, ±0.30 m pile allowance, 5 m profile step).
- Terrain: synthetic and idealised (a single sloped plane or a regular wave); on real sites slope and undulation occur together and the results cannot simply be added.
- Scope: volume along the table lines only; service roads, transformer/inverter pads, drainage channels and topsoil stripping are not included.
- These are simulation results, not measurements. Draw your own site or upload your survey file to see table-by-table earthworks in the simulator.
Related reading: Solar tracker slope tolerance, soil and earthworks · GCR optimization: LCOE or NPV? · Solar tracker vs fixed tilt
Frequently asked questions
Does a solar tracker site have to be graded?
No. If the slope along the axis stays below the tolerance (15% in our model) and the ground does not undulate beyond the pile allowance, tables follow the terrain and no grading is needed. In our simulations earthworks were zero up to a 15% uniform slope.
How much earthwork does a tracker need on sloped land?
On a 10 ha synthetic site with 74 m tables we calculated 3,270 m³/ha of cut + fill at an 18% axis slope, 7,021 m³/ha at 20% and 16,638 m³/ha at 25%. Final quantities come from a topographic survey.
Do shorter tracker tables reduce earthworks?
Yes, especially on rolling terrain. With ±1 m amplitude and a 100 m wavelength a 74 m table needed 537 m³/ha and a 37 m table 4 m³/ha. The number of tables and drives, however, nearly doubles.
Can earthworks be estimated from satellite elevation data?
For pre-feasibility, yes, but 25–30 m resolution data cannot see short-wavelength humps and may understate the volume. Final quantities should come from a drone or GNSS topographic survey.
We deliver the whole project: feasibility, engineering, procurement, installation and grid connection, in Türkiye and abroad. Simulate your site for free first, then let our team prepare a tailored quote.
Start the Simulation and Get a Quote
The ratios on this page are typical industry ranges and are not binding; exact values are determined by a site-specific analysis.