 BTR Enerji · Solar Tracker
How Much More Does a Solar Tracker Produce? Simulated Energy Gain at 25 Sites Worldwide
We simulated the same PV plant at 13 sites in the world's main tracker markets and 12 sites in Türkiye, once with single-axis trackers and once with fixed-tilt racking. Across the 13 international sites the tracker produced +12.8% to +25.7% more energy (median 22.2%), with the highest gains in the US Southwest and Australia. Here are the data, the method and what explains the differences.
The short answer
In sunny, clear-sky regions a single-axis tracker produces roughly 20–26% more energy per year than a fixed-tilt plant of the same DC capacity. Gains fall where a large share of the irradiation is diffuse (cloud, haze, dust): about 18% in Riyadh and Abu Dhabi and 13% in Bavaria. Most of the extra energy arrives in the morning and evening: in our Türkiye sites 74–83% of it came before 09:00 and after 16:00.
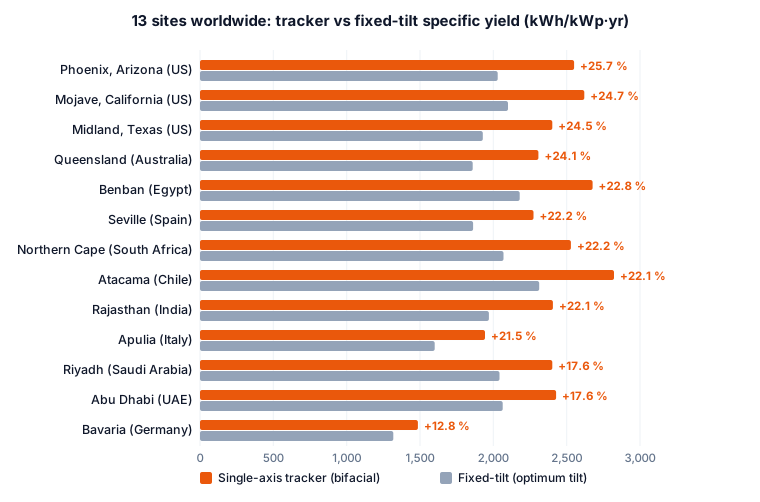
Tracker gain at 13 sites worldwide
| Location | Annual GHI (kWh/m²) | Diffuse share | Fixed (kWh/kWp) | Tracker (kWh/kWp) | Gain |
|---|---|---|---|---|---|
| Phoenix, Arizona (US) | 2,133 | 20.2% | 2,030 | 2,551 | +25.7% |
| Mojave, California (US) | 2,188 | 18.8% | 2,100 | 2,620 | +24.7% |
| Midland, Texas (US) | 2,028 | 23.4% | 1,928 | 2,402 | +24.5% |
| Queensland (Australia) | 1,980 | 26.4% | 1,859 | 2,307 | +24.1% |
| Benban (Egypt) | 2,442 | 28.1% | 2,180 | 2,677 | +22.8% |
| Seville (Spain) | 1,901 | 30.5% | 1,862 | 2,274 | +22.2% |
| Northern Cape (South Africa) | 2,230 | 25.6% | 2,069 | 2,529 | +22.2% |
| Atacama (Chile) | 2,591 | 16.3% | 2,313 | 2,823 | +22.1% |
| Rajasthan (India) | 2,100 | 25.2% | 1,970 | 2,406 | +22.1% |
| Apulia (Italy) | 1,611 | 38.4% | 1,600 | 1,943 | +21.5% |
| Riyadh (Saudi Arabia) | 2,268 | 34.3% | 2,042 | 2,402 | +17.6% |
| Abu Dhabi (UAE) | 2,271 | 33.8% | 2,064 | 2,428 | +17.6% |
| Bavaria (Germany) | 1,209 | 47.6% | 1,318 | 1,486 | +12.8% |
The US Southwest (Arizona, California, Texas) and Queensland lead with 24–26%: very low diffuse share and long clear days. Egypt's Benban, South Africa's Northern Cape, Seville, Rajasthan and the Atacama form a broad middle group around 22%. In absolute terms the Atacama is in a class of its own, with a tracker plant above 2,800 kWh/kWp per year.
Why is the gain lower at some sites?
A tracker turns the modules towards the sun, so it captures more direct (beam) irradiance. Diffuse irradiance, scattered by clouds, haze and dust, comes from the whole sky and barely depends on module orientation. The higher the diffuse share of annual irradiation, the smaller the tracker's advantage.
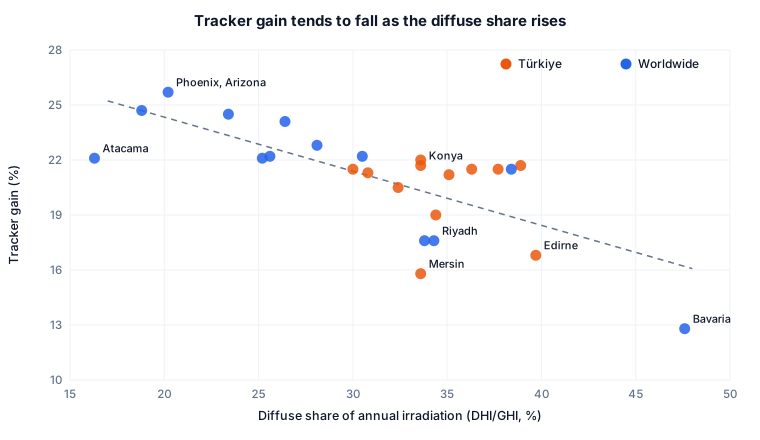
- Desert haze: Riyadh and Abu Dhabi are extremely sunny, yet dust and humidity push the diffuse share to about 34%; the tracker gain stays at 17.6%.
- Local irradiance differences: even within one province the result changes with the exact point. On the coast at Mersin (Türkiye) we found 15.8%, on the Tarsus plain 18.8% and at Silifke 22.2%. Satellite-based irradiance varies along coasts and mountain fronts, so decide with the site's own coordinates, not a regional average.
- Inverter clipping: at very high irradiance (Atacama) the inverter limit cuts part of the tracker's midday surplus; a poorly chosen DC/AC ratio gives some of the gain away.
Pick your location and draw your land on the map. Get hourly-weather-based yield, a tracker vs fixed-tilt comparison, a bill of materials and the payback period, free of charge.
Free Solar Tracker Simulation
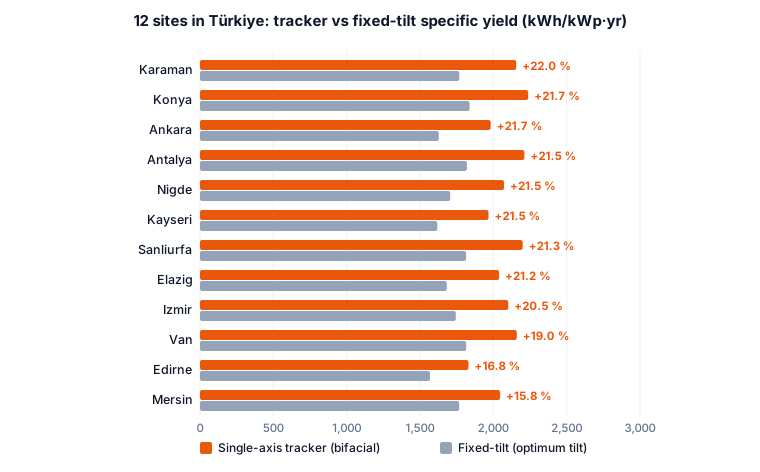
Tracker gain in Türkiye: 12 provinces
In Türkiye, 10 of the 12 sites gained 19–22% (median 21.4%). Konya (Karapınar), Antalya and Sanliurfa reach more than 2,200 kWh/kWp per year with trackers. In Konya the tracker adds 400 kWh/kWp per year, about 400 MWh per MWp, or roughly USD 36k per MWp per year at USD 0.09/kWh.
| Location | Annual GHI (kWh/m²) | Diffuse share | Fixed (kWh/kWp) | Tracker (kWh/kWp) | Gain |
|---|---|---|---|---|---|
| Karaman | 1,829 | 33.6% | 1,768 | 2,156 | +22.0% |
| Konya | 1,884 | 33.6% | 1,838 | 2,238 | +21.7% |
| Ankara | 1,653 | 38.9% | 1,628 | 1,982 | +21.7% |
| Antalya | 1,876 | 30.0% | 1,820 | 2,212 | +21.5% |
| Nigde | 1,719 | 36.3% | 1,706 | 2,073 | +21.5% |
| Kayseri | 1,632 | 37.7% | 1,618 | 1,967 | +21.5% |
| Sanliurfa | 1,884 | 30.8% | 1,814 | 2,200 | +21.3% |
| Elazig | 1,705 | 35.1% | 1,683 | 2,039 | +21.2% |
| Izmir | 1,793 | 32.4% | 1,744 | 2,102 | +20.5% |
| Van | 1,794 | 34.4% | 1,815 | 2,160 | +19.0% |
| Edirne | 1,557 | 39.7% | 1,568 | 1,831 | +16.8% |
| Mersin | 1,806 | 33.6% | 1,767 | 2,046 | +15.8% |
When during the day does the extra energy arrive?
Fixed-tilt output peaks at noon; a tracker faces east in the morning and west in the evening, widening the production curve. For self-consumption (shift work, cooling) and markets where hourly prices rise in the evening, that energy is also worth more per kWh.
Method
All figures come from our own simulator, with identical assumptions at every site:
- Weather: PVGIS typical meteorological year (TMY), hourly; annual GHI and diffuse share from the same data.
- Plant: 5 ha of land (about 3 MWp), 710 W bifacial modules; single-axis tracker with a north-south axis and backtracking; fixed-tilt facing the equator at a tilt close to the latitude (capped at 35°).
- Losses: temperature, soiling (cleaning interval by rainfall), incidence angle (IAM), cabling and mismatch, inverter clipping (default DC/AC design), MV transformer; wind stow from hourly wind data.
- Gain: annual AC yield of the tracker plant divided by that of the fixed-tilt plant at the same DC capacity.
Want to show this data on your own site? Use the free embeddable solar tracker gain calculator (one line of code, no cookies).
These are simulation results, not measurements. They compare locations with one consistent method; the exact figure for your land depends on slope, ground albedo, wind and design. For uncertainty ranges see P50 and P90 explained.
Does the gain pay for the extra investment?
Trackers typically cost 8–12% more up front than fixed-tilt racking; a gain of around 20% pays that back within a few years at most sunny sites. See solar tracker cost and solar tracker vs fixed-tilt; on windy sites also account for stow losses: wind stow strategy.
Frequently asked questions
How much more energy does a solar tracker produce than fixed-tilt?
In our simulations at 13 international sites a single-axis tracker produced 12.8% to 25.7% more annual energy than fixed-tilt at the same capacity (median 22.2%). In Türkiye, 10 of 12 sites gained 19-22%.
Where do solar trackers gain the most?
Where irradiation is high and mostly direct: the US Southwest (Arizona, California, Texas) and Queensland reached 24-26% in our simulations.
Why is the tracker gain lower in some places?
A tracker captures more direct irradiance; where a large share is diffuse (cloud, haze, desert dust) the advantage shrinks. Local irradiance differences and inverter clipping also reduce it.
Can I use these numbers for an investment decision?
No. They compare locations with one consistent method. A decision needs a site-specific simulation with your coordinates, terrain, albedo and design, which you can run free in our simulator.
We deliver the whole project: feasibility, engineering, procurement, installation and grid connection, in Türkiye and abroad. Simulate your site for free first, then let our team prepare a tailored quote.
Start the Simulation and Get a Quote
The ratios on this page are typical industry ranges and are not binding; exact values are determined by a site-specific analysis.