BTR Enerji · Solar Tracker
Hail Stow Strategy for Solar Trackers: How Much Energy Does It Cost, and Which Way Should Panels Turn?
One hour of hail stow on a summer afternoon costs 374 kWh/MWp in Konya, 96 if facing the sun. 20 h a year: 0.09–0.36% of annual yield.
Articles on single-axis tracker plant design, terrain and electrical engineering, cost and agrivoltaics. Every article is written by our engineering team and updated regularly.
📰 Industry news: tracker developments worldwide →
One hour of hail stow on a summer afternoon costs 374 kWh/MWp in Konya, 96 if facing the sun. 20 h a year: 0.09–0.36% of annual yield.
A tracker stuck flat loses 19.6–23.4% of its annual yield; stuck at 55° east, 31.8–35.6%. Simulation at 4 sites plus a preventive maintenance checklist.
10 ha tracker site: no grading up to a 15% axis slope, 7,021 m³/ha at 20%. On ±1 m rolling terrain 37 m tables cut earthworks from 537 to 4 m³/ha.
What do bifacial modules add on a single-axis tracker? 8 simulated sites: 2.5–8.7% on grass; soil to sand in Konya adds 69 kWh/kWp a year.
How much does wind stow cost a tracker plant in yield? Gust factor, stow threshold and data for 12 locations: at an 18 m/s threshold the loss is below 0.2% at most sites; lowering it to 12 m/s can push it to 4.7%.
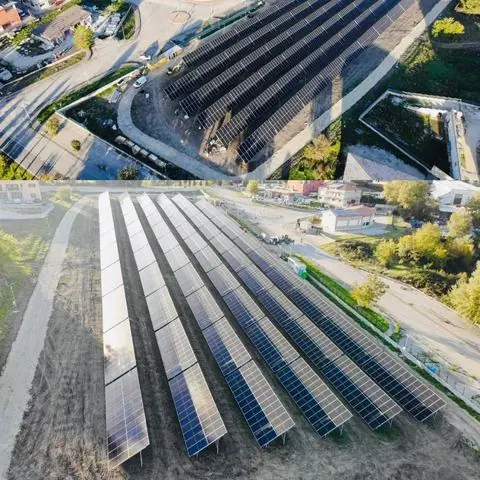
How single-axis trackers handle sloped and undulating land: axis tilt, cross-axis slope, slope-aware and row-by-row backtracking, the electrical impact of row shading and which elevation data you need.
How to size DC cables in a utility-scale tracker PV plant: ampacity, the voltage-drop formula with a worked example, distributed string inverters vs central inverters, and realistic cable quantities.
How many modules fit in a 1500 V string? The cold-temperature Voc formula, choosing the design temperature, and results for 12 locations from 10 years of ERA5 data.
What slope can a solar tracker handle? North-south and east-west slope limits, pile reveal tolerance, cut and fill (earthworks) estimation, geotechnical survey and topographic survey for tracker PV plants.
Same 10 ha site, GCR 0.20→0.50: LCOE is lowest at sparse rows, NPV highest at dense rows. With a fixed grid capacity the optimum is GCR 0.32–0.35. 3 sites simulated.
What do P50, P75 and P90 energy yields mean, how are they calculated and why do lenders care? Worked example for a 10 MWp plant plus 10 years of data for 9 locations: P90 is about 93% of P50.
How much more does a single-axis tracker produce than fixed-tilt? Simulated at 25 sites: +12.8% to +25.7%, highest in the US Southwest and Australia.
What drives solar tracker cost? Cost items, 8-12% extra investment over fixed-tilt and a 10 MWp example with a 3.4-year payback. Free site-specific estimate.
Single-axis tracker or fixed-tilt? Yield (13-26% gain at 25 simulated sites), investment, LCOE, payback, land use and maintenance compared.
What is a solar tracker system and how does it work? Simulated at 25 sites: 13-26% more energy than fixed-tilt PV. Cost, land needs and a free simulation.
What are the types of solar trackers? Horizontal single-axis, tilted single-axis and dual-axis trackers compared: energy gain, cost, maintenance and how to choose the right solar tracker for your PV plant.
How an agrivoltaic single-axis solar tracker works: light management, suitable crops, clearance height and row spacing, land equivalent ratio (LER) and agri-PV standards.
Step-by-step agrivoltaic tracker design: crop light demand, clearance height, row spacing, machinery access, irrigation, livestock, control strategy and feasibility.
Utility-scale solar tracker design and feasibility software: terrain-aware backtracking, hourly yield simulation, automatic layout, automated BOM, NPV/IRR/LCOE and P50/P90. Free to use.