 BTR Enerji
How Much Energy Does 1 MW of Solar Trackers Produce? By Site, Month and Hour
In our simulations 1 MWp of single-axis trackers produces 1,672–2,404 MWh a year (1.67–2.40 million kWh), depending on the site. In Seville that is 2,232 MWh against 1,829 MWh for fixed tilt. A tracker does not just produce more; it produces at different hours. All figures come from our own simulator: they are calculations, not measurements.
Short answer: annual production of 1 MW of trackers
- 1 MWp (DC): 1,672,000–2,404,000 kWh/yr; Seville 2,232,000 kWh.
- 1 MWac, DC/AC ≈ 1.19: Seville 2,645,000 kWh/yr.
- Strongest and weakest month (Seville): July 278 MWh, February 97 MWh.
- Over 25 years (Seville): about 53.2 GWh/MWp with 0.4% annual module degradation.
Pick your location and draw your land on the map. Get hourly-weather-based yield, a tracker vs fixed-tilt comparison, a bill of materials and the payback period, free of charge.
Free Solar Tracker Simulation
Annual production by site
We simulated the same plant at each site with a PVGIS typical meteorological year. The MWac column shows the default design (DC/AC ≈ 1.19):
| Site | Tracker (MWh/MWp·yr) | Fixed (MWh/MWp·yr) | Gain | Tracker (MWh/MWac·yr) | Daily (kWh/kWp) | Capacity factor (AC) |
|---|---|---|---|---|---|---|
| Riyadh (Saudi Arabia) | 2,404 | 2,025 | 18.8% | 2,849 | 6.6 | 32.5% |
| Antalya (Türkiye) | 2,246 | 1,857 | 20.9% | 2,662 | 6.2 | 30.4% |
| Seville (Spain) | 2,232 | 1,829 | 22.0% | 2,645 | 6.1 | 30.2% |
| Konya (Türkiye) | 2,189 | 1,802 | 21.4% | 2,594 | 6.0 | 29.6% |
| Puglia (Italy) | 1,970 | 1,641 | 20.0% | 2,334 | 5.4 | 26.6% |
| Erzurum (Türkiye) | 1,877 | 1,583 | 18.6% | 2,225 | 5.1 | 25.4% |
| Bucharest (Romania) | 1,672 | 1,455 | 14.9% | 1,981 | 4.6 | 22.6% |
Do not mix MWp and MWac: module power is DC, grid capacity is AC, and which one "1 MW" means changes the figure by about 18%. More on the ratio: solar tracker DC/AC ratio and clipping.
How does production change month by month?
| Month | Tracker (MWh/MWp) | Fixed (MWh/MWp) | Tracker gain |
|---|---|---|---|
| Jan | 107 | 106 | 1% |
| Feb | 97 | 93 | 4% |
| Mar | 209 | 179 | 17% |
| Apr | 198 | 159 | 24% |
| May | 246 | 183 | 34% |
| Jun | 268 | 189 | 42% |
| Jul | 278 | 198 | 40% |
| Aug | 234 | 178 | 31% |
| Sep | 205 | 169 | 21% |
| Oct | 175 | 162 | 8% |
| Nov | 103 | 102 | 1% |
| Dec | 112 | 109 | 3% |
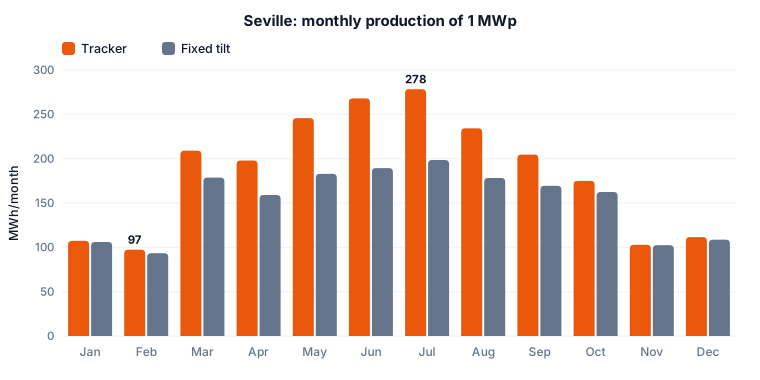
The annual 22.0% gain is not spread evenly. In Seville the tracker leads by 42% in June and only 1% in November. In winter the sun is low and days are short, and backtracking flattens the modules to avoid row shading. Use a table like this, not the annual average, for monthly cash flow or PPA delivery profiles.
What does hourly production look like?
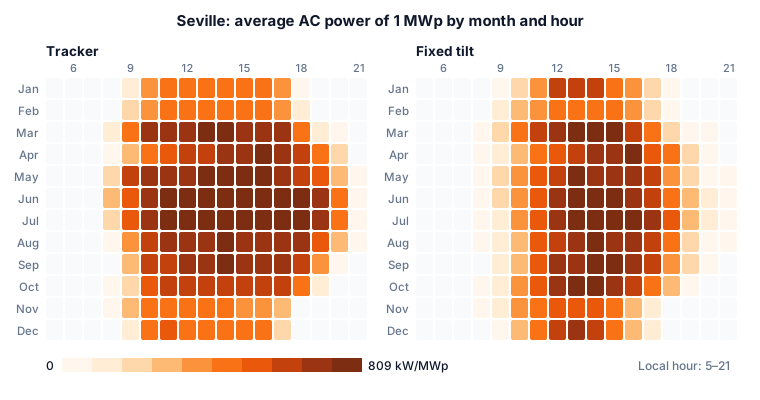
In July at 09:00 local time, the tracker averages 564 kW/MWp against 148 kW/MWp for fixed tilt; at 20:00 the values are 472 and 86. Around midday the difference closes. Local clock time matters: Seville's solar noon falls after 14:00 in summer, so late afternoon carries far more energy there than in Riyadh:
| Site | Before 10:00, tracker | Before 10:00, fixed | From 16:00, tracker | From 16:00, fixed |
|---|---|---|---|---|
| Riyadh (Saudi Arabia) | 22.4% | 19.1% | 11.4% | 6.5% |
| Antalya (Türkiye) | 15.7% | 9.6% | 22.0% | 15.2% |
| Seville (Spain) | 6.6% | 2.9% | 33.9% | 28.6% |
| Konya (Türkiye) | 18.1% | 11.9% | 20.1% | 13.6% |
| Erzurum (Türkiye) | 23.2% | 17.3% | 13.1% | 8.6% |
| Puglia (Italy) | 20.1% | 13.6% | 19.0% | 12.9% |
| Bucharest (Romania) | 14.8% | 9.8% | 21.9% | 16.4% |

Why does the hourly profile matter?
In markets with many low-priced solar hours, energy delivered early and late in the day is often worth more than midday energy. Annual MWh alone does not show this. For a PPA or a site with its own load, compare the month-by-hour profile with the price or load curve. The simulator produces this 12×24 map for your site, and it can be exported in the Excel financial model.
What changes these numbers?
- Year-to-year weather: these are typical years; for lender figures see P50 and P90 explained.
- Location: tracker energy gain by location.
- Layout: row spacing changes both yield and MW: land per MW for trackers.
- Operation: stuck rows and soiling cost production directly: tracker operation and maintenance.
Method
Simulations used our pvlib-based tool: PVGIS typical meteorological year, hourly calculation, 710 W bifacial modules, ±55° rotation with backtracking, a plant of about 5 MW, and default temperature, soiling, snow, cable, inverter and transformer losses. Fixed tilt uses the same modules and kWp at its own optimum tilt. Tables are scaled to 1 MWp and show first-year output. Results are simulations, not measurements.
Frequently asked questions
How many kWh does 1 MW of solar trackers produce per year?
In our simulations 1 MWp produced 1,672,000–2,404,000 kWh a year across seven sites, from Bucharest to Riyadh.
Is 1 MWac the same as 1 MWp?
No. Behind 1 MWac there is more module capacity, set by the DC/AC ratio. In Seville at DC/AC ≈ 1.19, 1 MWac produces 2,645 MWh a year and 1 MWp 2,232 MWh.
Which month do trackers produce the most?
In Seville, July (278 MWh/MWp). The weakest is February (97 MWh/MWp). The lead over fixed tilt ranges from 1% to 42% by month.
Do trackers produce more in the morning and evening?
Yes. In Seville 41% of annual tracker output comes before 10:00 or from 16:00 onwards, against 31% for fixed tilt.
We deliver the whole project: feasibility, engineering, procurement, installation and grid connection, in Türkiye and abroad. Simulate your site for free first, then let our team prepare a tailored quote. Get a quote in 48 hours →
Start the Simulation and Get a Quote
The ratios on this page are typical industry ranges and are not binding; exact values are determined by a site-specific analysis.