 BTR Enerji
Solar Tracker DC/AC Ratio: Inverter Clipping and the Yield of Each Added MWp
In our simulations a single-axis tracker plant at a DC/AC ratio of 1.20 clips 1.4–4.4% of its annual energy, and 3.5–7.9% at 1.30. The right ratio is not one number: it depends on whether grid capacity or land is your limit. All figures below come from our own simulator at seven sites; they are calculations, not measurements.
Short answer: what DC/AC ratio suits a tracker?
- Starting point: 1.10–1.25 for trackers. Our simulator starts at 1.20 and searches the 1.10–1.30 band.
- If grid capacity is fixed: adding DC still raises output, but each added MWp contributes less. In Seville the new MWp yields 91% of the average going from 1.0 to 1.1, and only 46% going from 1.3 to 1.4.
- If land (DC) is fixed: adding inverters is usually cheaper than the energy clipped, which pulls the ratio down.
- Trackers clip more: at the same ratio in Seville the tracker clips 3.0% and fixed tilt 2.1%.
Pick your location and draw your land on the map. Get hourly-weather-based yield, a tracker vs fixed-tilt comparison, a bill of materials and the payback period, free of charge.
Free Solar Tracker Simulation
How much energy is clipped at each site?
We held the hourly DC output of 1 MWp constant and changed only the AC capacity, so the difference comes from the DC/AC ratio alone:
| Site | Yield (MWh/MWp·yr) | 1.10 | 1.20 | 1.30 | 1.40 | Clipped hours (1.20) |
|---|---|---|---|---|---|---|
| Erzurum (Türkiye) | 1,877 | 1.8% | 4.4% | 7.7% | 11.1% | 814 |
| Konya (Türkiye) | 2,189 | 1.5% | 4.3% | 7.9% | 11.6% | 990 |
| Antalya (Türkiye) | 2,246 | 0.9% | 3.2% | 6.4% | 10.0% | 906 |
| Riyadh (Saudi Arabia) | 2,404 | 0.8% | 3.2% | 6.6% | 10.5% | 966 |
| Seville (Spain) | 2,232 | 0.8% | 3.0% | 6.1% | 9.5% | 824 |
| Puglia (Italy) | 1,970 | 0.6% | 2.6% | 5.5% | 8.8% | 660 |
| Bucharest (Romania) | 1,672 | 0.2% | 1.4% | 3.5% | 6.2% | 325 |
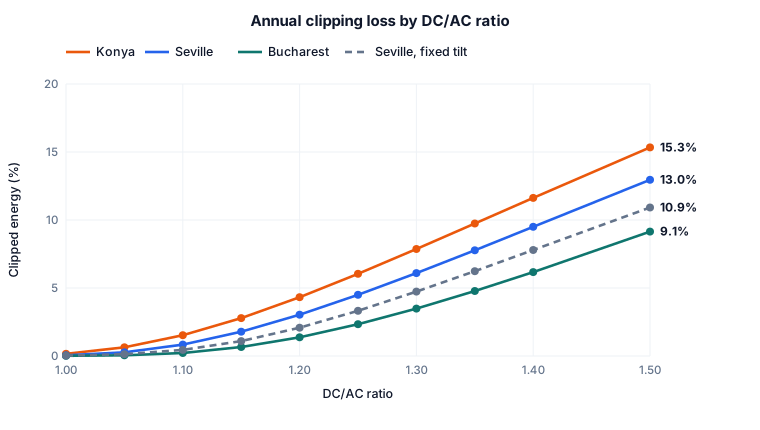
The ranking is the interesting part: Riyadh has the highest yield here but not the highest clipping; cool, clear Konya and Erzurum clip more. Clipping does not follow annual irradiation alone. In cold, clear air modules come close to rated power, while in hot regions high cell temperature already pulls DC power down. A ratio that works in one climate should not be copied to another without checking.
Why do trackers clip more than fixed tilt?
Fixed tilt reaches its peak around midday. A tracker stays close to peak for hours in summer, so it sits against the inverter limit for longer:
| DC/AC | Tracker clipping | Fixed clipping | Tracker clipped hours | Fixed clipped hours | Tracker gain |
|---|---|---|---|---|---|
| 1.00 | 0.1% | 0.0% | 1 | 2 | 23.1% |
| 1.10 | 0.8% | 0.5% | 301 | 100 | 22.6% |
| 1.20 | 3.0% | 2.1% | 824 | 541 | 21.9% |
| 1.30 | 6.1% | 4.7% | 1,228 | 898 | 21.3% |
| 1.40 | 9.5% | 7.8% | 1,554 | 1,147 | 20.7% |
| 1.50 | 13.0% | 10.9% | 1,771 | 1,311 | 20.2% |
In Seville, fixed tilt only reaches the tracker's clipping at 1.20 when its ratio is 1.24. Note the last column too: as the ratio rises, the tracker's advantage over fixed tilt falls from 23.1% to 20.2%. Carrying high fixed-tilt ratios over to a tracker gives back part of the gain at the inverter.
With fixed grid capacity, what does each added MWp produce?
When the permit or grid agreement fixes AC capacity, the question becomes how many MWp to put behind 1 MWac. The annual yield of the DC added at each step in Seville:
| DC/AC step | Tracker added yield (MWh/MWp) | Share of average | Fixed added yield (MWh/MWp) | Share of average |
|---|---|---|---|---|
| 1.0 → 1.1 | 2,110 | 91% | 1,797 | 95% |
| 1.1 → 1.2 | 1,677 | 72% | 1,503 | 80% |
| 1.2 → 1.3 | 1,309 | 57% | 1,189 | 63% |
| 1.3 → 1.4 | 1,054 | 46% | 978 | 52% |
| 1.4 → 1.5 | 875 | 38% | 841 | 45% |
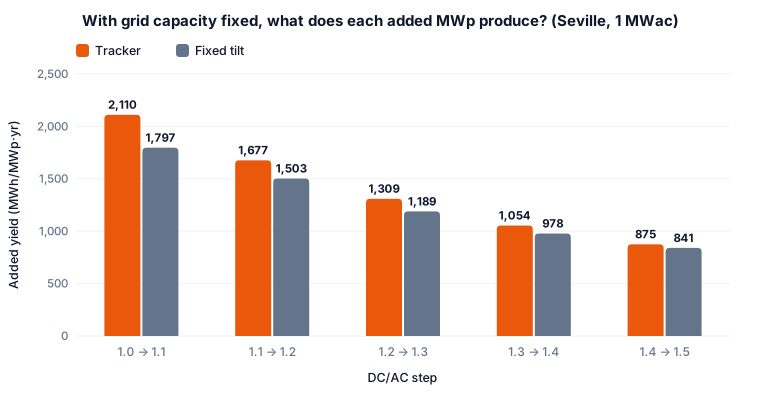
Share is relative to the average yield at a ratio of 1.0. The tracker's lead shrinks at every step: it adds 314 MWh more than fixed tilt at the first step and only 34 MWh at the last. Where clipping is heavier the order reverses: in Konya, past a ratio of 1.3, an added MWp produces less on a tracker than on fixed tilt (891 MWh against 912 MWh), because the tracker already spends so long at peak.
To decide, multiply the MWh in the table by your own selling price and compare with the cost of the added DC (modules, structure, cable, installation). Land counts as well: how much land does 1 MW of trackers need?

If land is fixed, is it worth adding inverters?
Now DC is fixed and AC is free. We ran the simulator's DC/AC optimization with a wider band (1.00–1.50) at all seven sites. It weighs the 25-year value of clipped energy against the cost of inverters, transformers and the AC side. The result was 1.01–1.06, and even a lower electricity price moved it up only slightly, because inverters are cheap relative to the energy they save.
That result assumes grid capacity is free and unlimited, which it is not. AC capacity needs a permit, and a high connection charge per kW moves the optimum up. That is why our simulator does not go below 1.10.
What else limits a high ratio?
- MPPT current limit: 710 W modules carry high current. On our sample site (6.04 MWp) the strings-per-MPPT limit required at least 17 inverters, which held the ratio at 1.19 with the selected inverter.
- Sub-hourly variation: hourly data averages out short peaks. The sub-hourly correction in our model adds 0.2–0.3 points of clipping at 1.20, so an hourly result alone slightly understates the loss.
- Layout density: DC capacity changes with GCR: GCR optimization.
- Site climate: see how yield changes by location: tracker energy gain by location.
Method
Simulations used our pvlib-based tool: PVGIS typical meteorological year, 710 W bifacial modules, ±55° rotation with backtracking, default temperature, soiling, snow and cable losses, and a sub-hourly clipping correction. Clipping and added-yield figures are after the inverter and before MV transformer loss, without inverter count rounding. Results are simulations, not measurements. Grid terms, permits and inverter compatibility must be checked for each project.
Frequently asked questions
What is a good DC/AC ratio for a solar tracker?
1.10–1.25 is a sound starting point. In our simulations annual clipping is 1.4–4.4% at 1.20 and 3.5–7.9% at 1.30. The final ratio depends on grid capacity, land and costs.
What is inverter clipping?
When DC power from the modules exceeds the inverter's AC limit, the excess cannot be delivered. It happens in the strongest hours of the year and accelerates as the DC/AC ratio rises.
Do trackers clip more than fixed tilt?
Yes. Trackers stay near peak power for longer. In Seville at 1.20 the tracker clips 3.0% over 824 hours, and fixed tilt 2.1% over 541 hours.
Should clipping be avoided completely?
Usually not. With fixed grid capacity, some clipping means more annual energy: in Seville, 1.2 MWp behind 1 MWac produces 379 MWh a year more than 1.0 MWp.
We deliver the whole project: feasibility, engineering, procurement, installation and grid connection, in Türkiye and abroad. Simulate your site for free first, then let our team prepare a tailored quote. Get a quote in 48 hours →
Start the Simulation and Get a Quote
The ratios on this page are typical industry ranges and are not binding; exact values are determined by a site-specific analysis.